CAN FOREFOOT VARUS WEDGES ENHANCE ANAEROBIC CYCLING PERFORMANCE IN UNTRAINED MALES WITH FOREFOOT VARUS?
Nicholas J. Dinsdale & Alun G. Williams
Institute for Performance Research, Manchester Metropolitan University, Crewe, CW1 5DU, United Kingdom
Original scientific paper
Abstract
There is limited research relating to cycling biomechanics, and more specifically, the use of foot orthotics to enhance cycling performance. Therefore, this study investigated the effect of forefoot varus wedges (foot orthotics) on cycling performance, as measured by anaerobic power output in a population of untrained males presenting with forefoot varus. Six untrained males (forefoot varus mean ± SD; 6.1 ± 1.7°) completed two separate 30 s Wingate Anaerobic tests (WAnT) on a Monark 824E cycle ergometer, one with and one without varus wedges, in a counterbalanced order. Although paired-sample t-tests revealed no significant difference P > .05 in mean power, peak power, and anaerobic fatigue between the two conditions, a Pearson’s product-moment correlation coefficient (r = .957, n = 6, P = .003) demonstrated that varus wedges offer greater performance benefits to riders with greater forefoot varus. These preliminary data suggest that correcting forefoot varus using wedges may improve short-term power output during cycling for individuals possessing high levels of forefoot varus.
Key words: Cycling biomechanics; foot orthotics; foot pronation; WAnT
INTRODUCTION
During one hour of cycling, a rider may average up to 5,000 pedal revolutions. The smallest amount of malalignment, whether anatomic or mechanically related, can lead to dysfunction, injury and impaired performance (Asplund & St Pierre, 2004). Many authors cite the use of orthotics in cycling to help alleviate knee problems (Holmes, Pruitt, & Whalen, 1994; Mellion, 1991; Schwellnus, Sole, Milligan, van Zyl, & Noakes, 1996) and reduce excessive foot pronation (Sanner & O’Halloran, 2000; Wanich, Hodgkins, Columbier, Muraski, & Kennedy, 2007).
Forefoot Alignment
Garbalosa, McClure, Catlin, and Wooden (1994) found that of the 234 measured feet, 87% had forefoot varus, 9% forefoot valgus, and 4% had a neutral forefoot-rearfoot relationship. According to Millslagle, Rubbelke, Mullin, Keener, and Swetkovich (2004), conventional or standard pedal systems are designed for the cyclist to be positioned on the pedal flat-footed, and are therefore only ideally suited to the 4% of the cycling population who do not have forefoot malalignment.
Foot/Pedal Interface Forces
Studies have demonstrated that the repetitive forces applied to the pedal during the downstroke (power-phase) are of a significant magnitude reaching 300-500 N (Davis & Hull, 1981; Farrell, Reisinger, & Tillman, 2003). These forces occur at the foot/pedal interface, reaching 3 times body mass during sprinting and equal to body mass during steady-state cycling. Hennig and Sanderson (1995) found that as power outputs increased so did the amount of foot pronation. Hannaford, Moran, and Hlavac (1986) reported that under light or moderate loads the simple longitudinal arch support or rearfoot support might be adequate, but when the load increases and the force is placed directly under the metatarsal heads, the foot will collapse in the direction that allows the forefoot to become parallel with the pedal. Moreover, forefoot varus exaggerates the amount of foot pronation which can lead to greater knee misalignment and potentially greater power loss (Sanner & O’Halloran, 2000).
Anaerobic versus Aerobic Loads at the Foot/Pedal Interface
Hice, Kendrick, Weeber, and Bray (1985) reported a statistical significant difference in oxygen consumption and heart rate in favour of wearing foot orthoses versus not wearing orthoses at submaximal aerobic intensity. In contrast, Anderson and Sockler (1990) found no statistical difference in oxygen consumption, expired ventilatory volume, or heart rate between wearing versus not wearing foot orthoses. However, the authors reported a trend toward greater mechanical efficiency as workloads approached maximal values when wearing orthotics. More recently, Millslagle et al. (2004) found no significant difference in cycling performance between the BiopedalTM (Biosport, Inc., 1988) varus adjusted foot position and a standard neutral foot position at the highest aerobic level. Similarly, Moran and McGlinn (1995) found no difference in cycling performance between a Biopedal varus adjusted foot position and a standard neutral foot position under steady-state aerobic conditions. However, in the same study, when using the 30 s WAnT, 9 of the 10 subjects demonstrated a significant increase in anaerobic power.
Study Aim and Hypothesis
Evidence regarding any effects of forefoot varus wedges on cycling performance is clearly lacking in the literature. Therefore, the aim of this study was to investigate the effect of forefoot varus wedges on cycling performance, as measured by anaerobic power output in a population of untrained males presenting with ‘forefoot varus’ bilaterally or unilaterally. It was hypothesised that: (i) a higher mean anaerobic power output would be achieved when wearing forefoot varus wedges, and (ii) that any performance benefits would be more pronounced in those with greater amounts of forefoot varus.
METHODS
Participants
Altogether, nine male participants volunteered for this study. Following screening to identify forefoot varus and pre-exercise health risks, three participants were found to be non-eligible and subsequently excluded. Therefore, six untrained male cyclists (mean ± SD; 24 ± 5 years, height 1.78 ± 0.05 m, body mass 79.7 ± 8.1 kg, body fat 10.3 ± 3.2%, forefoot varus 6.1 ± 1.7°) participated in this study. Skinfold measurements were taken at three sites (triceps, chest, and subscapular) using a Harpenden skinfold caliper. Percent body fat measurements were determined as described in Jackson and Pollock (1985).
Pilot Work
Test-retest intrarater reliability of forefoot goniometer measurements and the WAnT protocol were established. Data were checked for heteroscedasticity prior to calculating 95% limits of agreement (LoA) (Nevill & Atkinson, 1997). Test-retest intrarater reliability for the goniometer measurements (n = 20) and the WAnT protocol for mean power (n = 5) were 0.25 ± 1.8° and -14 ± 33 W respectively, indicating good reliability for both. The WAnT has been shown to be both valid and reliable (Del Coso, & Mora-Rodriguez, 2006; Stickley, Hetzler, & Kimura, 2008). Throughout the pilot and main study, the applied resistance for the Monark 824E cycle ergometer was set at 80 g per kg body mass (Inbar, Bar-Or & Skinner, 1996). The dependent variables were peak power (PP), mean power (MP) and the anaerobic fatigue index (FI).
Protocol
Participants completed two separate 30 s maximal efforts, one with varus wedges and one without, with ≥ 24 h recovery between tests. The order of testing was counterbalanced. Prior to testing, participants were requested to refrain from dietary intake for 2 h and from strenuous exercise for 24 h. The seat and handlebars were adjusted for each participant. Participants completed a standardised 5 minute warm-up pedalling at 60 rpm with a 60 W load, interspersed with a 5 s submaximal sprint at the end of each minute of warm-up. Following a 2 minute recovery period, the participant was instructed to commence pedalling (no resistance applied) and upon reaching a cadence of 90 rpm the test load was introduced, each participant then completing a 30 s WAnT. Immediately on completion, the test load was removed and the participant continued to pedal for 5 minutes to aid recovery.
Measuring Forefoot Varus
Forefoot varus is the relationship of the rearfoot to the forefoot and generally defined as the relative inversion (tilting inwards) of the forefoot on the rear foot. Participants were measured for forefoot varus using a goniometer as described previously by Garbalosa et al. (1994). The mean varus value for each foot was calculated from three separate measurements (Table 1).
Table 1.
Forefoot varus measurements (degrees)
Participant |
Left foot |
Right foot |
Mean |
|
1 |
4.0 |
5.5 |
4.8 |
|
2 |
7.5 |
8.0 |
7.8 |
|
3 |
4.5 |
5.0 |
4.8 |
|
4 |
7.5 |
5.0 |
6.3 |
|
5 |
4.0 |
6.5 |
5.3 |
|
6 |
7.0 |
|
9.0 |
8.0 |
The mean value for the left and right foot (mean ± SD; 6.1 ± 1.7°)
Forefoot Varus Wedges
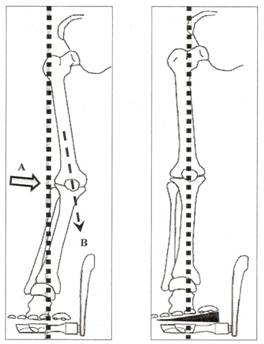
During the downstroke of pedalling, the forefoot tends to collapse allowing the forefoot to become parallel with the pedal (Figure 1a) (Hannaford et al., 1986). Consequently, foot pronation, internal rotation and knee adduction increase (Fig. 1a; arrow A) (Asplund, & St Pierre, 2004). This causes the applied resultant force to be lower (Fig. 1a; arrow B). Varus wedges support the medial forefoot in individuals with forefoot varus, thus prevents the foot from collapsing (Figure 1b).
|
|
Figure 1a |
Figure 1b |
Although forefoot 1º varus wedges are commercially available, there is limited research in support of their use or, the number of wedges required for a given amount of forefoot varus. Therefore, the number of wedges used in the study was based on our previous work, practical experience and the aim of making a meaningful intervention. One 1º wedge was used for every 2º of varus measured by goniometer, up to a maximum of 4 wedges (Table 2).
Table 2.
Number of wedges used with respect
to measured forefoot varus
Measured forefoot varus |
Number of wedges inserted |
1 to 2° |
1 |
3 to 4° |
2 |
5 to 6° |
3 |
≥ 7° |
4 |
Statistical Power and Sample Size Estimation
The sample size (n = 6) was estimated using a power (≥ 0.8) to detect the smallest worthwhile effect of (3%) improvement in mean power output using GPOWER version2 computer program (Erdfelder, Faul, & Buchner, 1996). This was established by using Pilot data (dependent variable) to calculate an effect size (1.2), and for repeated-measure designs, the direct link between statistical power and test-retest variability of the dependent variable as described in Atkinson and Nevill (1998) and Batterham and Atkinson (2005).
Statistical Analysis
One-tailed, paired-sample t-tests were used to examine potential differences between means of PP, MP, and FI. All statistical analyses were conducted using SPSS 16.0 for Windows. Pearson’s product-moment correlation (two-tailed) was used to examine for correlation between difference in PP, MP, and FI output, for each condition, and the level of mean forefoot varus. A P value < 0.05 was accepted as statistically significant. Data are presented as mean ± standard deviation.
RESULTS
Paired-samples t-tests were conducted to compare output performance between the two conditions with and without forefoot varus wedges for PP, MP, and FI. Output for PP with wedges was 874 ± 155 W, and without wedges 849 ± 176 W, P = 0.21. Similarly, output for MP with wedges was 674 ± 102 W and without wedges 649 ± 123W, P = 0.10. Output for FI with wedges was 39.7 ± 8.0% and without wedges 41.0 ± 10.0%, P = 0.24.
A Pearson’s correlation revealed a positive correlation between the difference in MP output and level of forefoot varus, r = 0.957, n = 6, P = 0.003. These results demonstrate a strong, positive correlation between the differences in MP output and forefoot varus (Figure 2).
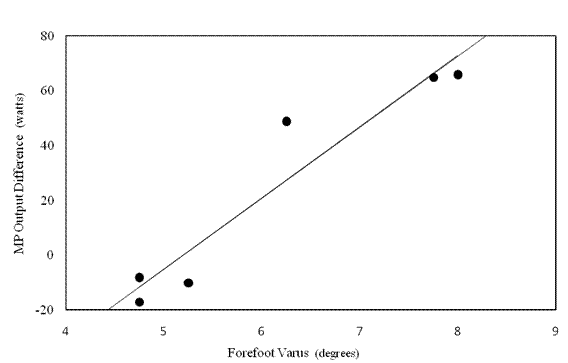
Figure 2. The scatter-plot demonstrates a strong significant correlation (P = 0.003) between differences in MP output (MP with wedges minus MP without wedges) and increasing levels of forefoot varus.
Discussion
This study examined the effect of forefoot varus wedges on cycling performance as measured by anaerobic power output using a 30 s WAnT on a cycle ergometer in a population of untrained males presenting with forefoot varus bilaterally or unilaterally. Although the output scores for MP, PP, and FI were not significantly different, the findings demonstrated some improvement in cycling performance represented by an increased output of 2.9% for PP, 3.8% for MP, and a lower FI rate (3.2%) in favour of using varus wedges. Generally, these findings are consistent with those of similar investigations using conventional foot orthoses (Anderson & Sockler, 1990) and Biopedal varus adjusted foot positions (Millslagle et al., 2004; Moran & McGlinn, 1995).
Intriguingly, while only three of the six cyclists (participants 2, 4, & 6) demonstrated an increase in MP output, the same three cyclists presented with the highest mean forefoot varus measurements (7.33 ± 0.95º); (Table 1). Moreover, there was a positive correlation between the two variables, r = 0.957 (P = 0.003) as shown in Figure1.
Moran and McGlinn (1995) using a 30 s WAnT found an increase (9.93%) in anaerobic MP output in favour of a Biopedal varus adjusted foot position compared with a neutral foot position in a population of cyclists presenting with forefoot varus. Furthermore, nine of the 10 cyclists demonstrated an increase in power output in the varus adjusted position. These changes were significant P < 0.01 with a large effect size (.71) and power rating (.67). In contrast, in the same study performing at an aerobic intensity, Moran and McGlinn found no significant difference P > 0.05 between a varus adjusted forefoot position and a neutral foot position.
The findings of this study using varus wedges and those of Moran and McGlinn using Biopedal varus adjusted foot position suggest that high intensity (anaerobic) cycling is more likely than lower intensity cycling to show subtle changes in power output. In support of this theory, Hannaford et al. (1986) and Hennig and Sanderson (1995) examined the effect of foot/pedal loadings. They found that for increasing power outputs the medial forefoot was subjected to higher foot/pedal loads, accompanied by increased foot pronation. These findings suggest that anaerobic cycling power outputs are related to increasing foot/pedal loads which are linked to increasing forefoot pronation and thus potential power loss.
Unlike previous studies, this study reported individual participant’s forefoot varus measurements, and the corresponding number of varus wedges used in testing. Consequently, this enabled the relationship between the level of forefoot varus and MP outputs to be examined. The strong and statistically significant correlation between these two variables, even though based on a small sample of 6 participants, could be of considerable interest to future research. Considering the high prevalence of forefoot varus (87%) found amongst cyclists (Garbalosa et al., 1994) the findings of this study may have implications across the cycling population. Cyclists presenting with higher levels of forefoot varus potentially have the most to gain.
Limitation of this study was the small sample size (n=6). A larger sample size would potentially allow for a smaller effect size to be detected for a given power. Furthermore, according to Hopkins (2000), Pearson’s correlation coefficient tends to overestimate the true correlation for small sample sizes (< 15). Therefore, for this study where n=6, readers should be cautious regarding data interpretation, and further work that seeks to replicate these findings is recommended.
CONCLUSION
Intriguingly and unique to this study, the findings support hypothesis (ii). This is the first study to examine and report a strong correlation between power output and forefoot varus. Any changes in power output due to foot pronation may only be subtle and may only be detectable in individuals presenting with forefoot varus when generating high foot/pedal loadings, conducive with anaerobic cycling. These preliminary data suggest that correcting forefoot varus using wedges may improve short-term power output during cycling for individuals possessing high levels of forefoot varus.
LITERATURE
Anderson, J.C., & Sockler, J.M. (1990). Effects of orthoses on selected physiologic parameters in cycling. Sports Medicine, 80,161-166. |
Asplund, M.D., & St Pierre, P. (2004). Knee pain and bicycling. The Physician and Sports Medicine, 32,23-30. |
Atkinson, G., & Nevill, A. M. (1998). Statistical methods for assessing measurement error (reliability) in variables relevant to sports medicine. Sports Medicine, 4, 217-238. |
Davies, R.R., & Hull, M.L. (1981). Measurement of pedal loading in bicycling: II. Analysis and results. Journal of Biomechanics, 14, 857-872. |
Del Coso, J., & Mora-Rodriguez, R. (2006). Validly of cycling peak power as measured by a short-sprint test versus the Wingate anaerobic test. Journal of Applied Physiology, Nutrition, and Metabolism, 31, 186-189. |
Erdfelder, E., Faul, F., & Buchner, A. (1996). GPOWER: A general power analysis program. Behavior Research Methods, Instruments, & Computers, 28, 1. |
Farrell, K.C., Reisinger, K.D., & Tillman, M.D. (2003). Force and repetition in cycling: possible implications for Iliotibial band friction syndrome. The Knee, 10, 103-109. |
Garbalosa, J.C., McClure, M.H., Catlin, P.A., & Wooden, M. (1994). The frontal plane relationship of the forefoot to the rearfoot in an asymptomatic population. Journal of Orthopaedic and Sports Physical Therapy, 20, 200-206. |
Hannaford, D.P.M., Moran, G.T., & Hlavac, A.M. (1986). Video analysis and treatment of overuse knee injury in cycling: a limited clinical study. Clinics in Podiatric Medicine and Surgery, 3,671-678. |
Hennig, E.M., & Sanderson, D.J. (1995). In-shoe pressure distributions for cycling with two types of footwear at different mechanical loads. Journal of Applied Biomechanics, 11, 68-80. |
Hice, G.A., Kendrick, Z., Weeber, K., & Bray, J. (1985). The effect of foot orthoses on oxygen consumption while cycling. Journal of American Podiatric Medical Association, 75, 513-516. |
Holmes, J.C., Pruitt, A. L., & Whalen, N.J. (1994). Lower extremity overuse in bicycling. Clinics in Sports Medicine, 13,187-203. |
Inbar, O., Bar-Or, O., & Skinner, J. (1996). The Wingate Anaerobic test. Campaign, IL: Human Kinetics. |
Jackson, A. S., & Pollock, M. L. (1985). Practical assessment of body composition. The Physician and Sports Medicine, 13, 76-90. |
Mellion, M.B. (1991). Common cycling injuries: management and prevention. Sports Medicine, 11,52-70. |
Millslagle, D., Rubbelke, S., Mullin, T., Keener, J., & Swetkovich, R. (2004). Effects of foot-pedal positions by inexperienced cyclists at the highest aerobic level. Perceptual and Motor Skills, 98, 1074-1080. |
Moran, G.T., & McGlinn, G.H. (1995). The effect of variations in the foot pedal interface on the efficiency of cycling as measured by aerobic energy cost and anaerobic power. Biomechanics in Sport, 12, 105-109. |
Nevill, A. M., & Atkinson, G. (1997). Assessing agreement between measurements recorded on a ratio scale in sports medicine and sports science. British Journal of Sports Medicine, 31, 314-318. |
Sanner, W.H., & O’Halloran, W.D. (2000). The biomechanics, etiology, and treatment of cycling injuries. Journal of American Podiatric Medical Association, 90,354-376. |
Schwellnus, M.P., Sole, G., Milligan, J., van Zyl, E., & Noakes, T.D. (1996). Biomechanical considerations in the aetiology and management of patellofemoral pain in cyclists. ACT Sports Medicine Australia, 28-31 October, 320-321. |
Stickley, C.D., Hetzler, R.K., & Kimura, I.F. (2008). Prediction of anaerobic power values from an abbreviated WAnT protocol. Journal of Strength and Conditioning Research, 22, 958-964. |
Wanich, T., Hodgkins, C., Columbier, J.A., Muraski, E., & Kennedy, J.G. (2007). Cycling injuries of the lower extremity. Journal of the American Academy of Orthopaedic Surgeons, 15, 748-756. |
MOGU LI KLINASTI ULOŠCI POBOLJŠATI ANAEROBNU BICIKLISTIČKU IZVEDBU KOD NETRENIRANIH MUŠKARACA SA DEFORMACIJOM ISKRENUTOG PREDNJEG DIJELA STOPALA UNUTRA?
Originalni naučni rad
Sažetak
Malo je istraživanja vezanih za biomehaniku vožnje bicikla, a još manje, vezanih za korištenje ortotike stopala s ciljem poboljšanja biciklističke izvedbe. S tim u vezi, ovo istraživanje se bavi efektima korištenja klinastih uložaka za iskrenuto stopalo na biciklističku izvedbu, mjerenu pomoću izlaza anaerobne snage na populaciji netreniranih muškaraca sa deformitetom iskrenutog stopala. Šest netreniranih muškaraca ( iskrenuti prednji dio stopala mean ± SD; 6.1 ± 1.7°) su dva puta odvojeno testirani pomoću Wingate Anaerobnog testa (WAnT) na Monark 824E bicikl ergometru, jednom sa i jednom bez uložaka, uravnoteženim redosljedom. Mada t test za zavisne uzorke nije pokazao statistički značajne razlike na nivou P > .05 kod srednje snage, maksimalne snage i anaerobnog zamora nakon dva tretmana, koeficijenti Pearsonove korelacije (r = .957, n = 6, P = .003) su pokazali da ulošci nude veću pomoć onim biciklistima sa većim deformitetom stopala. Ovi preliminarni rezultati sugerišu korigovanje iskrenutog prednjeg stopala koristeći klinaste uloške može da poboljša kratkotrajnu snagu za vrijeme vožnje bicikla kod osoba sa visokim nivoom deformiteta prednjeg iskrenutog stopala.
Ključne riječi: biomehanika vožnje bicikla, ortotika stopala, pronacija stopala, WAnT
Corresponding author:
Nicholas J. Dinsdale BSc (Hons), MSc
Clinical Director
NJD Sports Injury Clinic
36 Moorland Crescent
Clitheroe
Lancashire, BB7 4PY,
United Kingdom
Tel.: 44 (1200) 427457
e-mail: nickdinsdale@fsmail.net